Especially when presenting them to a non-technical audience

One of the biggest challenges involved in solving business problems using machine learning is effectively explaining your model to a non-technical audience.
For example, if you work as a data scientist in an internship or a full-time position at a company, at some point you may have to present the results of your work to management. Similarly, if you decide to start a business based on machine learning, you will have to explain your models to stakeholders and investors in a way that makes sense. In both situations, your audience may lack a detailed understanding of machine learning algorithms. They probably aren’t concerned with the number of layers in your neural network or the number of trees in your random forest. These are the questions that really matter to them:
- What business value does your model potentially add?
- How well is your model performing?
- Why should we trust your model?
If you can answer these questions, your audience will have a better understanding of your work as a data scientist and how it can provide tangible value.
The goal of this article is to demonstrate how you can answer these questions and leverage frameworks such as yellowbrick, LIME, and SHAP to provide visual explanations of your model’s performance and behavior regardless of how complex it is.
What business value does your model add?
As data scientists and machine learning practitioners, we take pride in our models and the technical aspects of our work. If you have a really solid understanding of the statistics and math behind your work and the algorithms that you chose or the flashy Python libraries that you used, you may be tempted to impress your stakeholders by making these details the focus of your presentation. By doing this, you are essentially trying to sell the technology first, which is a great strategy for a technical conference, but not a very good strategy for a business pitch or a presentation to management.
“You’ve got to start with the customer experience and work backward to the technology. You can’t start with the technology then try to figure out where to sell it.” — Steve Jobs, Apple’s Worldwide Developers Conference, 1997.
Instead, you need to sell the business value of your work. In order to do this, think about how you can answer some of the following questions:
- What problem is your machine learning model aimed at solving?
- How can your machine learning model benefit the company?
- How will your machine learning model benefit the company’s customers?
By answering these questions, you are making your work relevant to your audience.
How well is your model performing?
There are two types of information that you should use when demonstrating your model’s performance to a general audience — performance metrics and visualizations. Performance metrics will summarize and quantify your model’s performance while visualizations will give your audience the bigger picture including little details that could have been missed when only looking at numerical metrics.
Performance Metrics
There are many performance metrics that data scientists like to use, ranging from simple and intuitive metrics like accuracy to more complex metrics like the root-mean-squared logarithmic error (RMSLE) or the weighted F1 score.
The most important thing to consider when choosing a metric is making sure that it is relevant in the context of the real-world problem that your model is trying to solve. To demonstrate this idea, consider the examples of real-world classification and regression problems listed below.
- Determining whether or not a patient has diabetes (classification).
- Predicting how many units of a product will be purchased by consumers (regression).
For the first problem, the consequences of a false positive (diagnosing someone who doesn’t have diabetes with diabetes) are not as serious as those of a false negative (failing to diagnose someone with diabetes). In this case, metrics such as accuracy and precision may be useful, but the one that is the most important is recall — which in this case measures the proportion of people with diabetes who were correctly diagnosed with diabetes. A model with a low recall will fail to diagnose many patients who actually have diabetes, leading to delays in treatment and further complications in patients. A model with a high recall will help prevent these negative outcomes.
For the second problem, let’s make the following assumptions (keep in mind this is a simplified example):
- It costs $4 for the company to produce a unit of the product.
- The company makes $6 when it sells a unit of the product.
- If the company produces fewer units than the actual demand from customers, the product will go out of stock and it will only make money from the units that were produced.
In this situation, we might be tempted to use a typical regression metric like the R² coefficient or the mean absolute error (MAE). But both metrics fail to answer the question that truly matters to the company — how much will they profit from producing the number of units that your model predicts they will need? We can use the equation below to compute the net profit that the model would produce for a given prediction:

Obviously, producing only 10 units has less potential for profit than producing 1000 units. For this reason, it might actually be better to scale this metric by computing the net profit margin or the ratio of the net profit to the initial profit generated by selling each unit of the product before taking costs into account:

This metric is something that company executives and stakeholders can easily interpret because it is relevant to the real-world problem that your model is trying to solve and it provides a clear picture of the value delivered by your model.
Visualizations
A visualization can often tell you much more than a single metric that summarizes the model’s performance across thousands of data points. While a picture is worth a thousand words, in data science a visualization may literally be worth a thousand numbers.
You can easily visualize your model’s performance using yellowbrick, a library that extends the Scikit-learn API and allows you to create performance visualizations. I have listed two examples of visualizations (one for classification, and one for regression) that can give your audience a more holistic picture of your model’s performance. You can find the code I used to create these visualizations on GitHub.
1. Class Prediction Error
The class prediction error plot, which can be created using the yellowbrick API, is a bar graph with stacked bars showing the classes that were predicted for each actual class in the testing data. This plot is especially useful in multi-class classification problems and allows the audience to get a better view of the classification errors made by your model. In the example below, I created a class prediction error plot for a logistic regression model trained to predict the sentiment (positive or negative) of movie reviews using the famous IMDB Movie Review Dataset.

2. Residual Plot
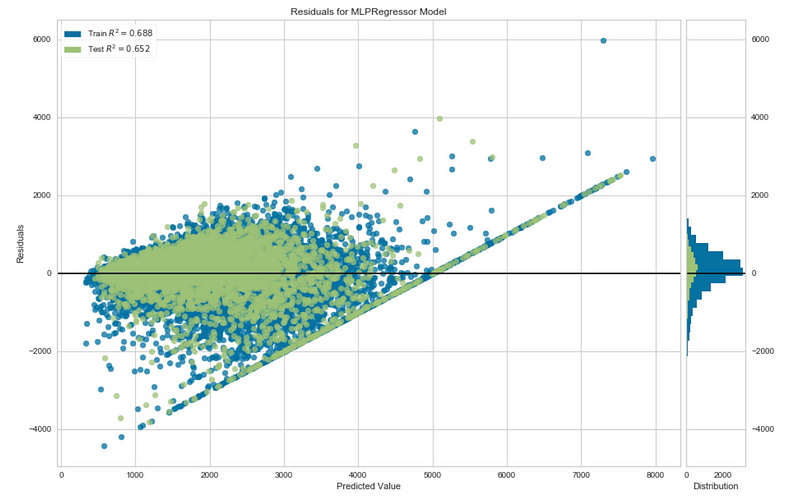
A residual plot is basically a scatterplot that shows the range of prediction errors (residuals) for your model for different predicted values. The yellowbrick API allows you to create a residual plot that also plots the distribution of the residuals for both the training and testing set. In the figure below, I created a residual plot for a neural network trained to predict housing prices using the California Housing Prices Dataset.

Why should we trust your model?
To answer this question, especially when dealing with a non-technical audience, you need to explain your model’s predictions in a way that doesn’t involve diving into complex mathematical details about your model.
LIME and SHAP are two useful Python libraries that you can use to visually explain the predictions generated by your model, which allows your audience to trust the logic that your model is using. In the sections below, I have provided visualizations and the code segments used to produce them. You can find the full code for these examples on GitHub.
LIME
LIME, a Python library created by researchers at the University of Washington, stands for Local Interpretable Model-agnostic Explanations. What this means is that LIME can provide understandable explanations of your model’s predictions on specific instances regardless of how complex the model is.
Using LIME on Tabular Data
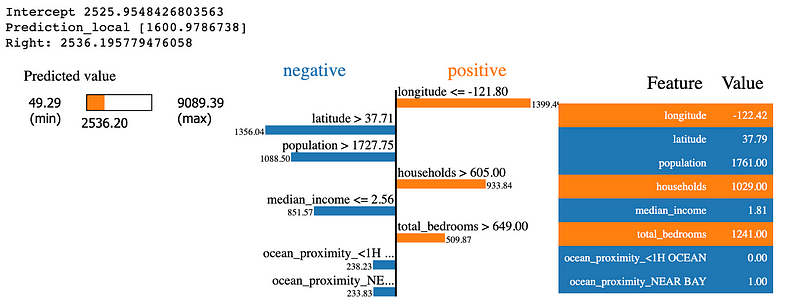
In the example below, I used the same neural network previously used to predict housing prices using the California Housing Prices Dataset and visualized the explanations for one particular prediction.
import lime
from lime.lime_tabular import LimeTabularExplainer
explainer = LimeTabularExplainer(X_train, feature_names=boston.feature_names,
class_names=['price'],                            categorical_features=categorical_features,
verbose=True,
mode='regression')
i = 25
exp = explainer.explain_instance(X_test[i], neural_network_pipeline.predict, num_features=8)
exp.show_in_notebook(show_table=True)

Here are some of the key features in the visualization above:
- It provides the values of the eight most important features that influenced the model’s predictions.
- It measures the impact of each feature on the prediction.
- Features that contributed to an increase in the house price are in orange and those that contributed to a decrease are in blue.
- It also gives us a general range of probable values for the target variable based on the model’s local behavior and shows us where the predicted value falls in this range.
Using LIME on Text Data
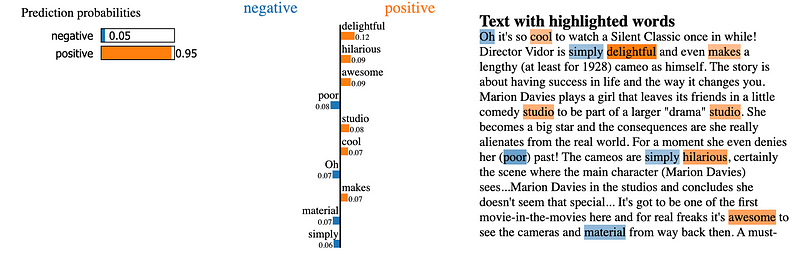
We can also use LIME to explain the predictions of models that work with text data. In the example below, I visualized the explanations for a prediction generated by a logistic regression model used for classifying the sentiment of movie reviews.
from lime.lime_text import LimeTextExplainer
i = 5
class_names = ['negative', 'positive']
explainer = LimeTextExplainer(class_names=class_names)
exp = explainer.explain_instance(X_test[i], logistic_reg_pipeline.predict_proba, num_features=10)
exp.show_in_notebook(text=True)

Based on the visualization above we can easily notice the following details:
- The model clearly thinks the movie review is positive (with a 95 percent probability).
- Words such as delightful, cool, hilarious, and awesome contributed to a higher probability of the review being positive.
- Words such as poor, simply, and material contributed slightly to a higher probability of the review being negative.
These details align with our human expectations of what the model should be doing which allows us to trust it even if we don’t fully understand the math behind it.
SHAP
SHAP (SHapley Additive exPlanations) is a similar Python library for model explanations, but it is a bit more complex than LIME both in terms of its usage and the information provided in its visualizations. SHAP borrows ideas from game theory, using the Shapley values defined in this paper to explain the output of machine learning models. Unlike LIME, SHAP also has specific modules for explaining different types of models but it also features model-agnostic explainers that work on all types of categories of models.
Using SHAP on Tabular Data
The code below demonstrates how to visualize the predictions of the same neural network in the previous example using the KernelExplainer module, which is designed to explain the output of any function.
import shap
shap.initjs()
explainer = shap.KernelExplainer(neural_network_pipeline.predict, X_train)
shap_values = explainer.shap_values(X_test.iloc[25,:], nsamples=200)
shap.force_plot(explainer.expected_value, shap_values, X_test.iloc[25,:])

The visualization above is interesting because it not only provides the value predicted by the model but also presents the competing influences of different features as arrows of different directions and lengths pushing the model’s prediction further from a base value.
Using SHAP on Text Data
SHAP can also be used on text data, but the process is a bit more complicated and the visual explanations for a single prediction are not as intuitive as those that can be created with LIME. The SHAP Explainer module can explain text-classification results by treating the text data as tabular data in the form of word counts or TF-IDF statistics for each word in a text document. In the example below, I used SHAP to create a visualization explaining the previous sentiment prediction generated by the logistic regression model.
X_train_processed = vectorizer.transform(X_train).toarray()
X_test_processed = vectorizer.transform(X_test).toarray()
explainer = shap.Explainer(logistic_reg_pipeline.steps[1][1],
                                 X_train_processed,                         feature_names=vectorizer.get_feature_names())
shap_values = explainer(X_test_processed)
i = 5
shap.plots.force(shap_values[i])

If we compare this visualization to the one produced by LIME for the same movie review, we can see that it gives us similar information, but is less intuitive because it doesn’t highlight words in the text of the movie review. However, it still helps us see the influence of specific words on the model’s prediction.
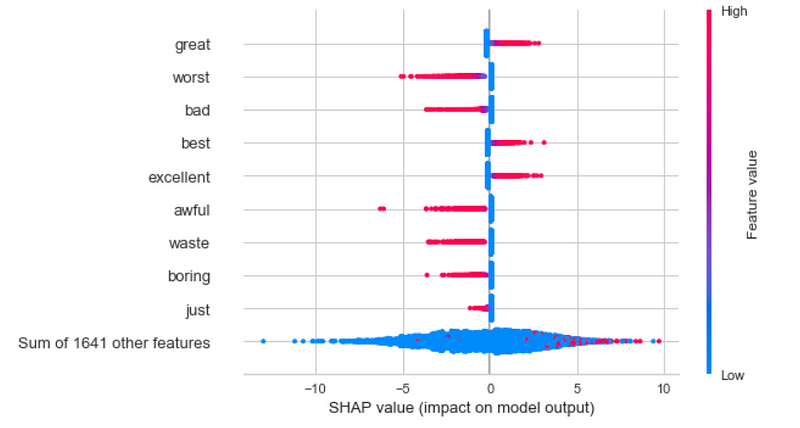
SHAP also allows us to view the influence of individual words on the model’s predictions using a bee swarm plot as demonstrated below.
shap.plots.beeswarm(shap_values)

Based on this plot, we can tell that words such as great, best, and excellent in a movie review cause the model to conclude that a review is positive while words such as worst, bad, awful, waste, and boring cause the model to conclude that a review is negative. This visualization gives us more confidence in this model because it demonstrates that the model is using the same logic that we as humans would likely use when determining if a movie review is positive or negative. This is the key to building trust in machine learning models.
Summary
- When explaining a machine learning model to an audience that is unfamiliar with the technical details of machine learning, always start by explaining the business value that your model can offer.
- To explain your model’s performance results to your audience, use metrics that are meaningful in the context of the problem, and create visualizations that show the big picture of your model’s performance.
- You can use LIME and SHAP to explain your model’s predictions in a way that allows your non-technical audience to trust your model.
As I mentioned earlier, please refer to this GitHub repository to find the full code that I used to train the models and create the corresponding visualizations used in this article.
Sources
- B. Bengfort and R. Bilbro, Yellowbrick: Visualizing the Scikit-Learn Model Selection Process, (2019), Journal of Open Source Software.
- M. T. Ribeiro, S. Singh, and C. Guestrin, Why should I trust you?: Explaining the predictions of any classifier, (2016), 22nd ACM SIGKDD International Conference on Knowledge Discovery and Data Mining.
- S. M. Lundberg, S. Lee, A Unified Approach to Interpreting Model Predictions, (2017), Advances in Neural Information Processing Systems 30 (NIPS 2017).
- A. L. Maas, R. E. Daly, P. T. Pham, D. Huang, A. Y. Ng, and C. Potts, Learning Word Vectors for Sentiment Analysis, (2011), The 49th Annual Meeting of the Association for Computational Linguistics.
- R.K. Pace and R. Barry, Sparse Spatial Autoregressions, (1997), Statistics and Probability Letters.