Using data from high energy collisions to detect new particles

An interesting branch of physics that is still being researched and developed today is the study of subatomic particles. Scientists at particle physics laboratories around the world will use particle accelerators to smash particles together at high speeds in the search for new particles. Finding new particles involves identifying events of interest (signal processes) from background processes.
The HEPMASS Dataset, which is publicly available in the UCI Machine Learning Repository, contains data from Monte Carlo simulations of 10.5 million particle collisions. The dataset contains labeled samples with 27 normalized features and a mass feature for each particle collision. You can read more about this dataset in the paper Parameterized Machine Learning for High-Energy Physics.
In this article, I will demonstrate how you can use the HEPMASS Dataset to train a deep learning model that can distinguish particle-producing collisions from background processes.
A Brief Introduction to Particle Physics
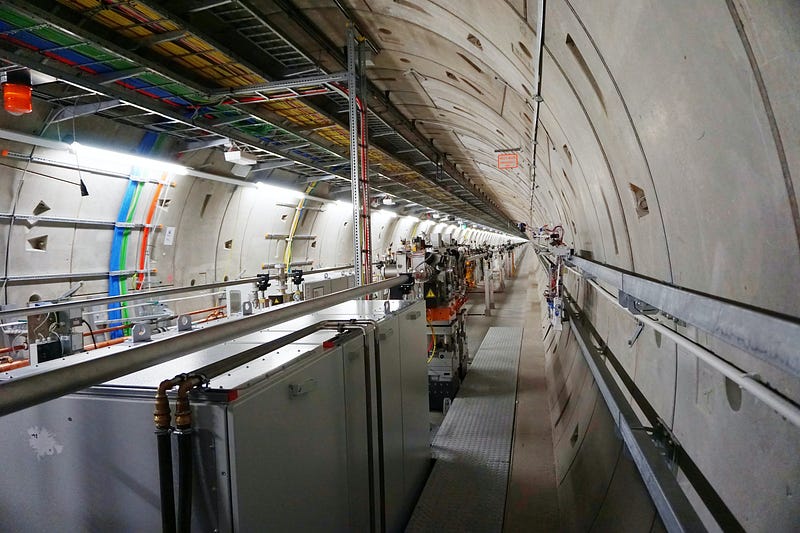
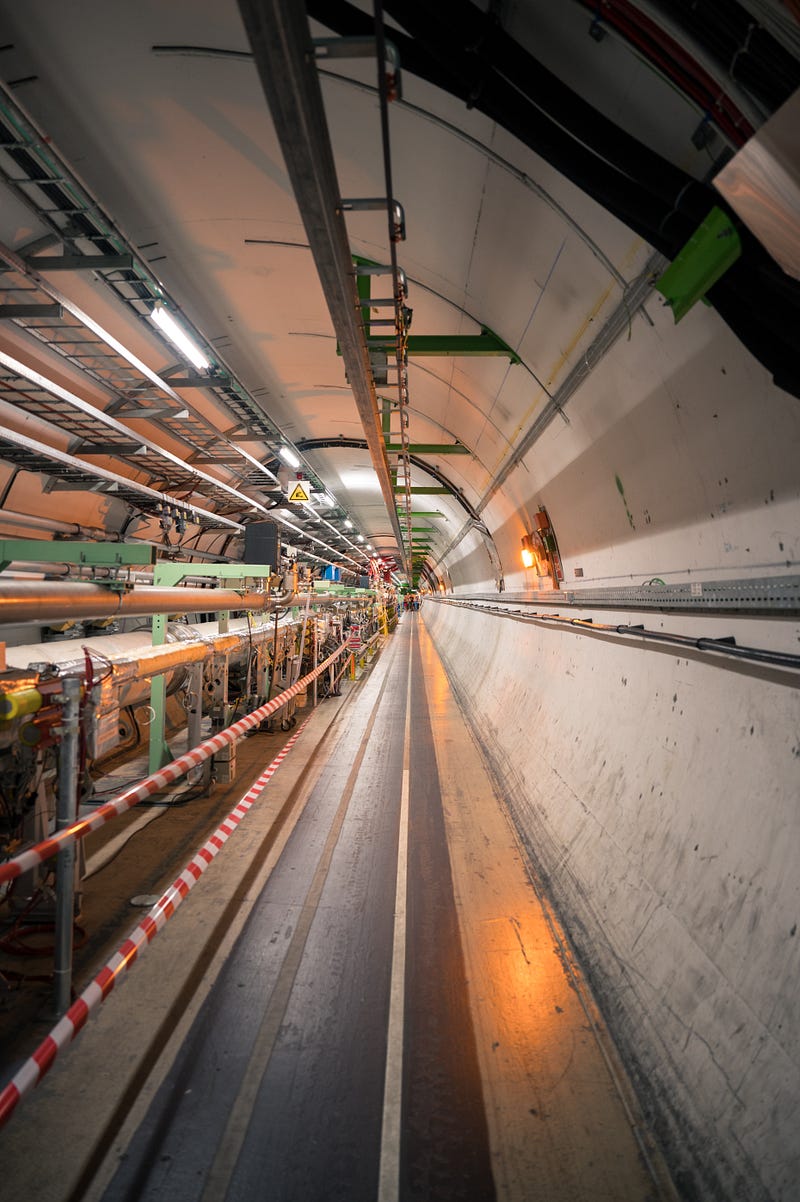
Particle physics is the study of the tiny particles that make up matter and radiation. This field is often referred to as high energy physics because the search for new particles involves using particle accelerators to collide particles at high energy levels and analyzing the byproducts of these collisions. Several particle accelerators and particle physics laboratories exist around the world. The Large Hadron Collider (LHC), built by the European Organization for Nuclear Research (CERN), is the world’s largest particle accelerator. The LHC is located in an underground tunnel near the Franco-Swiss border and features a 27-kilometer ring of superconducting magnets.

Imagine performing millions of particle collisions in a particle accelerator like the LHC, pictured above, and then trying to make sense of the data from those experiments. This is where deep learning can help us.
Importing Libraries
In the code below, I simply imported some of the basic Python libraries for data manipulation, analysis, and visualization. Please refer to this GitHub repository to find the full code used in this article.
import numpy as np
import pandas as pd
import matplotlib.pyplot as plt
import seaborn as sns
%matplotlib inline
Reading the Data
The HEPMASS Dataset comes with separate training and testing sets. In order to make the model evaluation process unbiased, I decided to read the training set first and leave the testing set untouched until after training and validating my models.
train = pd.read_csv('all_train.csv.gz')
Calling the Pandas info function on this dataframe produces the following summary for each of the columns.
<class 'pandas.core.frame.DataFrame'>
RangeIndex: 7000000 entries, 0 to 6999999
Data columns (total 29 columns):
 #   Column   Dtype
---  ------   -----
 0   # label  float64
 1   f0       float64
 2   f1       float64
 3   f2       float64
 4   f3       float64
 5   f4       float64
 6   f5       float64
 7   f6       float64
 8   f7       float64
 9   f8       float64
 10  f9       float64
 11  f10      float64
 12  f11      float64
 13  f12      float64
 14  f13      float64
 15  f14      float64
 16  f15      float64
 17  f16      float64
 18  f17      float64
 19  f18      float64
 20  f19      float64
 21  f20      float64
 22  f21      float64
 23  f22      float64
 24  f23      float64
 25  f24      float64
 26  f25      float64
 27  f26      float64
 28  mass     float64
dtypes: float64(29)
memory usage: 1.5 GB
The first column in the dataset corresponds to the class label indicating whether or not the collision produced a particle. Predicting this label is basically a binary classification task.
Exploratory Data Analysis
Now that we have the data, we can use seaborn to create some visualizations and understand it better.
Visualizing the Class Distribution
We can take a look at the distribution of classes using Seaborn’s countplot function as demonstrated below.
sns.countplot(train['# label'])

Based on the plot above, we can see that the classes are evenly distributed, with 3.5 million samples corresponding to background processes and the other 3.5 million corresponding to signal processes that produced particles. Note that a label of 1 corresponds to a signal process while a label of 0 corresponds to a background process.
Visualizing the Distributions of Different Features
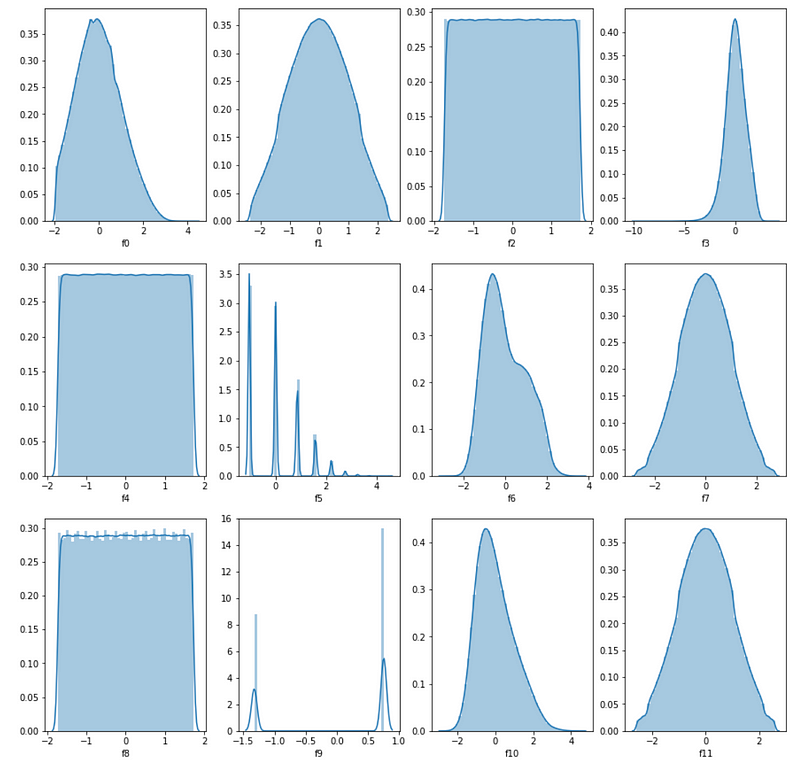
We can also visualize the distributions of the features extracted from each simulated collision as demonstrated in the code below.
cols = 4
fig, axes = plt.subplots(ncols=cols, nrows=3, sharey=False, figsize=(15,15))
for i in range(12):
    feature = 'f{}'.format(i)
    col = i % cols
    row = i // cols
    sns.distplot(train[feature], ax=axes[row][col])

Several of the features above tend to follow similar probability distributions. Many of the features seem to follow approximately normal distributions with a slight skew towards the left or right while others such as f2, f4, and f5 roughly follow a uniform distribution.
Data Preprocessing
Scaling Mass
Unlike the scaled features, the mass feature has not been normalized or scaled, so we should scale it in order to make it easier for deep learning models to use it.
from sklearn.preprocessing import StandardScaler
scaler = StandardScaler()
train['mass'] = scaler.fit_transform(train['mass'].values.reshape(-1, 1))
Training and Validation Split
In the code below, I used the classic train_test_split function from Scikit-learn to split the data into training and validation sets. Based on the code, 70 percent of the data was used for training and the remaining 30 percent was used for validation.
from sklearn.model_selection import train_test_split
X = train.drop(['# label'], axis=1)
y = train['# label']
X_train, X_valid, y_train, y_valid = train_test_split(X, y, test_size=0.3, random_state=42)
Training Deep Learning Models
Now we are finally ready to train deep learning models to identify particle-producing collisions. In this section, I followed three steps for creating an optimal deep learning model:
- Defined the basic architecture and hyperparameters for the network.
- Tuned the hyperparameters of the network.
- Retrained the model with the best-performing hyperparameters.
I used the validation data to measure the performance of models with different hyperparameter configurations.
Defining the Neural Network Architecture and Hyperparameters
In the code below, I used a Keras extension called Keras Tuner to optimize the hyperparameters for a simple neural network with three hidden layers. You can read more about this tool and how to install it using the Keras Tuner documentation page.
from keras.regularizers import l2 # L2 regularization
from keras.callbacks import *
from keras.optimizers import *
from keras.models import Sequential
from keras.layers import Dense
from kerastuner import Hyperband
n_features = X.values.shape[1]
def build_model(hp):

    hp_n_layers = hp.Int('units', min_value = 28, max_value = 112, step = 28)
    model = Sequential()
    model.add(Dense(hp_n_layers, input_dim=n_features, activation='relu'))
    model.add(Dense(hp_n_layers, activation='relu'))
    model.add(Dense(hp_n_layers, activation='relu'))
    model.add(Dense(1, activation='sigmoid'))
    hp_learning_rate = hp.Choice('learning_rate', values = [1e-2, 1e-3, 1e-4])
    # Compile model
    model.compile(loss='binary_crossentropy',
                  optimizer=Adam(learning_rate=hp_learning_rate),
                  metrics=['accuracy'])
    return model
tuner = Hyperband(build_model,
                  objective = 'val_accuracy',
                  max_epochs = 10,
                  factor = 3,
                  directory = 'hyperparameters',
                  project_name = 'hepmass_deep_learning')
In the code above, I used Keras Tuner to define hyperparameter options for both the number of units in each hidden layer of the network and the learning rate used when training the network. I tested the following options for each hyperparameter:
- Number of hidden layers: 28, 56, 84, and 112.
- Learning rate: 0.01, 0.001, 0.0001.
This is by no means an exhaustive list and if you want to truly find the best hyperparameters for this problem, you can try experimenting with many more hyperparameter combinations.
Hyperparameter Tuning
Now that the neural network architecture and hyperparameter options have been defined, we can use Keras Tuner to find the best hyperparameter combinations.
The code segment below is an optional callback that I added to clear the training output at the end of the training run for each model in the hyperparameter search. This callback makes the output cleaner in a Jupyter Notebook or Jupyter Lab environment.
import IPython
class ClearTrainingOutput(Callback):

    def on_train_end(*args, **kwargs):
        IPython.display.clear_output(wait = True)
In the code below, I ran a simple search on the hyperparameters to find the best model. This search process involves training and validating different hyperparameter combinations and comparing them to find the best performing model.
tuner.search(X_train, y_train, epochs=4,
             validation_data = (X_valid, y_valid),
             callbacks = [ClearTrainingOutput()])
# Get the optimal hyperparameters
best_hps = tuner.get_best_hyperparameters(num_trials = 1)[0]
print(f"""
Optimal hidden layer size: {best_hps.get('units')} \n
optimal learning rate: {best_hps.get('learning_rate')}.""")
Running the search yields the following optimal hyperparameters.
Optimal hidden layer size: 112

optimal learning rate: 0.001.
Training the Best Model
Now that the hyperparameter search is complete, we can retrain a model with the best hyperparameters.
model = tuner.hypermodel.build(best_hps)
history = model.fit(X_train, y_train, epochs=4, validation_data = (X_valid, y_valid))
The training process above produces the following output for each epoch.
Epoch 1/4
153125/153125 [==============================] - 150s 973us/step - loss: 0.2859 - accuracy: 0.8691 - val_loss: 0.2684 - val_accuracy: 0.8788
Epoch 2/4
153125/153125 [==============================] - 151s 984us/step - loss: 0.2688 - accuracy: 0.8788 - val_loss: 0.2660 - val_accuracy: 0.8799
Epoch 3/4
153125/153125 [==============================] - 181s 1ms/step - loss: 0.2660 - accuracy: 0.8801 - val_loss: 0.2645 - val_accuracy: 0.8809
Epoch 4/4
153125/153125 [==============================] - 148s 969us/step - loss: 0.2655 - accuracy: 0.8806 - val_loss: 0.2655 - val_accuracy: 0.8816
Based on the training output above, we can see that the best model achieved a validation accuracy of just over 88 percent.
Testing the Best Model
Now we can finally evaluate the model using the separate testing data. I scaled the mass column as usual and used the Keras evaluate function to evaluate the model from the previous section.
test = pd.read_csv('./all_test.csv.gz')
test['mass'] = scaler.fit_transform(test['mass'].values.reshape(-1, 1))
X = test.drop(['# label'], axis=1)
y = test['# label']
model.evaluate(X, y)
The code above produces the output below.
109375/109375 [==============================] - 60s 544us/step - loss: 0.2666 - accuracy: 0.8808
[0.26661229133605957, 0.8807885646820068]
Based on this output, we can see that the model achieved a loss of about 0.2667 and just over 88 percent accuracy on the testing data. This level of performance is what we would expect based on the training and validation results and we can see that the model is not overfitting.
Summary
In this article, I demonstrated how to use the HEPMASS dataset to train a neural network to identify particle-producing collisions. This is an interesting application of deep learning to the field of particle physics and will likely become more popular in research with advances in both fields. As usual, you can find the full code for this article on GitHub.
Sources
- CERN, Facts and figures about the LHC, (2021), CERN Website.
- Wikipedia, Monte Carlo method, (2021), Wikipedia the Free Encyclopedia.
- P. Baldi, K. Cramer, et. al, Parameterized Machine Learning for High-Energy Physics, (2016), arXiv.org.