Introduction
As of October 2020, the COVID-19 pandemic has claimed over 1 million lives across the world and over 41 million people have been infected. Understanding the factors and policies that influence the spread of the virus can help governments make informed decisions in order to control infections and deaths until a vaccine becomes widely available.
The goal of this article is to answer the following questions:
- What are the factors and policies that have the greatest impact on the number of cases and deaths across the world?
- How can we predict the number of COVID-19 cases, deaths, and recoveries in the future?
Datasets
In order to answer the questions above, I aggregated data from the following sources:
- COVID-19 Data Repository by the Center for Systems Science and Engineering (CSSE) at Johns Hopkins University: https://github.com/CSSEGISandData/COVID-19
- Policy Data From Oxford Coronavirus Government Response Tracker (OxCGRT): https://ourworldindata.org/policy-responses-covid
I used data aggregated from both sources to train three neural networks that can forecast the number of COVID-19 cases, deaths, and recoveries in any nation months into the future based on a wide range of factors including:
- GDP
- Government response to the coronavirus, including stay-at-home and social distancing restrictions.
- The change in mobility of its population since the start of the pandemic.
- Demographic data about its population.
- Past data regarding the number of cases, deaths, and recoveries.
Source Code
All of the code that I used to build the models and visualizations described in this post are publicly available and can be accessed in the following GitHub repository: https://github.com/AmolMavuduru/COVID19FactorAnalysis.
A Detailed Look at the Data
The data used for this project can be divided into four different parts, each represented as separate data frames/tables in the code: policy data, mobility data, demographic data, and COVID-19 time-series statistics.
Policy Data
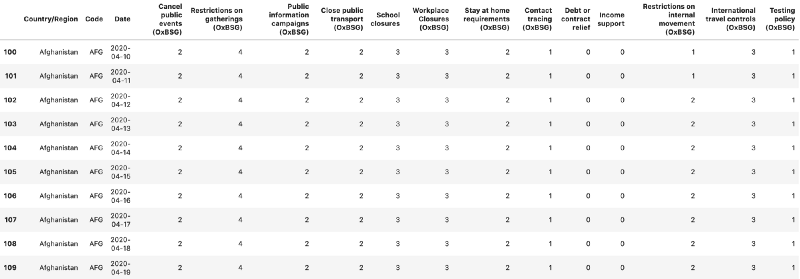
The policy data, extracted from the OxCGRT dataset, contains information about the policies implemented by the government in each country to control the spread of COVID-19. The policy data is available for each day after the start of the pandemic.
Mobility Data
The mobility data, also extracted from the OxCGRT dataset, tracks the percent change in movement to public places such as grocery stores, residential areas, and parks since a baseline period between January and February 2020.

Demographic Data
The demographic data contains information about the characteristics of each country such as statistics regarding the age of the population, the country’s GDP (gross domestic product), and medical information such as the prevalence of diabetes. This data was also extracted from the OxCGRT website provided earlier.

COVID-19 Time-Series Statistics
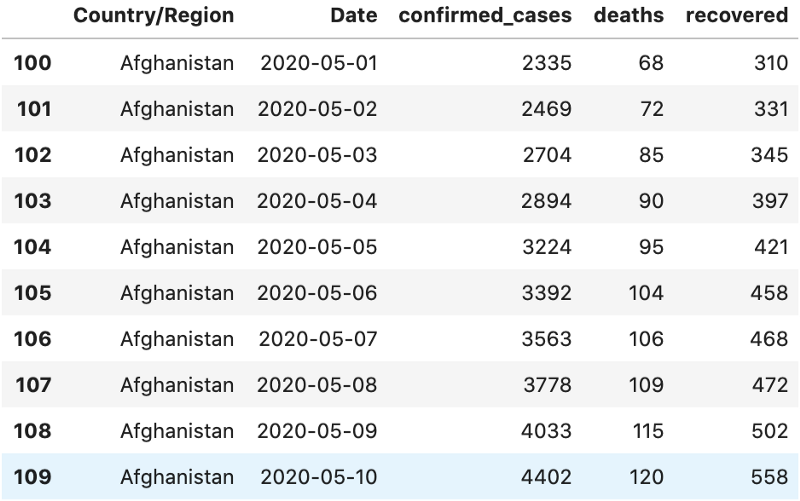
This data contains the target variables that the models in this project are designed to predict — the number of COVID-19 cases, deaths, and recoveries for each country. This data was downloaded from the JHU CSSE COVID-19 Dataset.
Exploratory Data Analysis and Visualizations
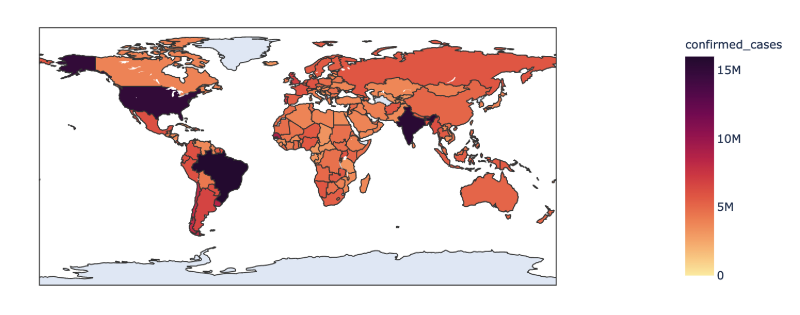
The visualizations presented below track the changes in confirmed cases, deaths, and recovered cases across the world since the start of the pandemic and until October. As the visualizations demonstrate, the pandemic started in China, but over time the United States, India, and Brazil became the three countries with the most cases and deaths.
Confirmed Cases Around the World
https://datapane.com/u/AmolMavuduru/reports/covid_cases?version=40
Deaths Around the World
https://datapane.com/u/AmolMavuduru/reports/covid_deaths?version=39
Recovered Cases Around the World
https://datapane.com/u/AmolMavuduru/reports/covid_recoveries?version=39
Factor Analysis
In order to determine which factors have the greatest impact on COVID-19 outcomes around the world, I used the data described earlier to create a country profile for every country with COVID-19 statistics. Each country profile contains demographic data, policy data, and mobility data. I framed this as a machine learning problem where I trained gradient-boosting models, using XGBoost, to predict the total number of cases, deaths, and recoveries based on the country profiles.
A helpful feature present in the XGBoost API is the ability to plot the importance of each feature considered by an XGBoost model after training. I used this feature to visualize and rank the importance of variables used in the country profiles. Each feature is ranked by its F-score, a metric that simply reports the number of times a feature was used to split a node in a decision tree used in a tree-based model such as XGBoost. The idea is that decision trees will select features with more predictive power more often, leading to higher F-scores for these features. The graphs below plot the F-scores for the top factors impacting the number of confirmed cases, deaths, and recoveries across all countries.
What factors have the greatest overall impact on the total number of confirmed cases?
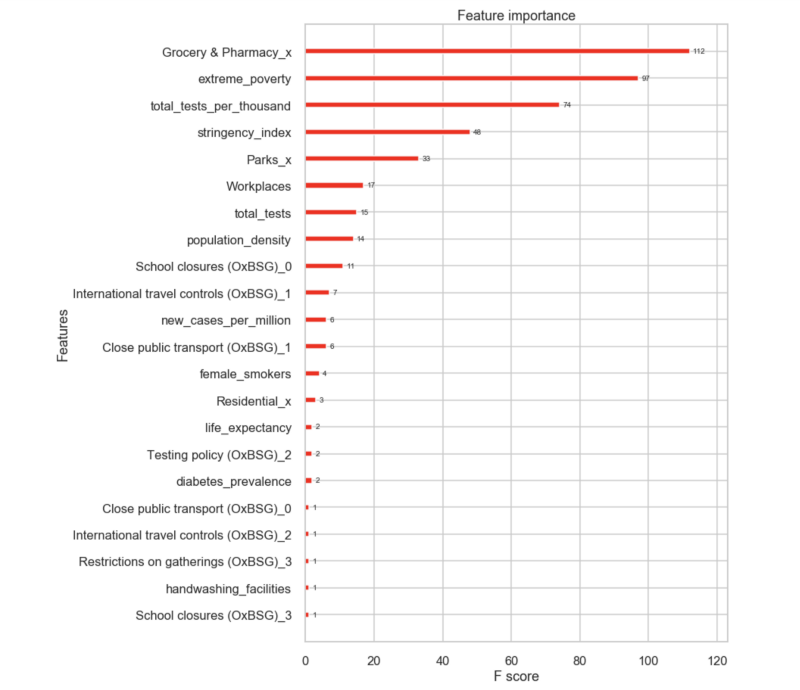
The justifications below may explain why some of the factors listed in the graph above were identified as the most important:
- Changes in Movement to Grocery Stores, Parks, Workplaces, and Residential Areas: the virus spreads from person-to-person contact, and as people more frequently visit public places such as grocery stores, parks, and offices in larger numbers, the probability of virus transmission increases.
- school, workplace, and public transport closures: closing public places limits the movement of people to these locations, reducing the probability of virus transmission through person-to-person contact.
- Extreme Poverty: countries with extreme poverty are more vulnerable to COVID-19 outbreaks due to crowded living conditions, poor sanitation, and less sophisticated healthcare infrastructure.
- stringency index: governments that enforce stricter restrictions on movement and mask-wearing may be able to better control the spread of the virus.
- population density: social distancing is difficult to practice in densely populated countries where the virus is likely prone to spread rapidly due to close contact between people.
- diabetes prevalence: research has shown that people with diabetes are more vulnerable to COVID-19 complications and people who get infected with COVID-19 have chances of developing symptoms of type 2 diabetes.
- testing policy: more widespread testing affects the number of reported cases and also makes contact-tracing efforts possible in order to control the spread of the virus.
- handwashing facilities: countries with more handwashing facilities will likely have better sanitation and thus will be better prepared to limit outbreaks in communities.
What factors have the greatest overall impact on the total number of deaths?
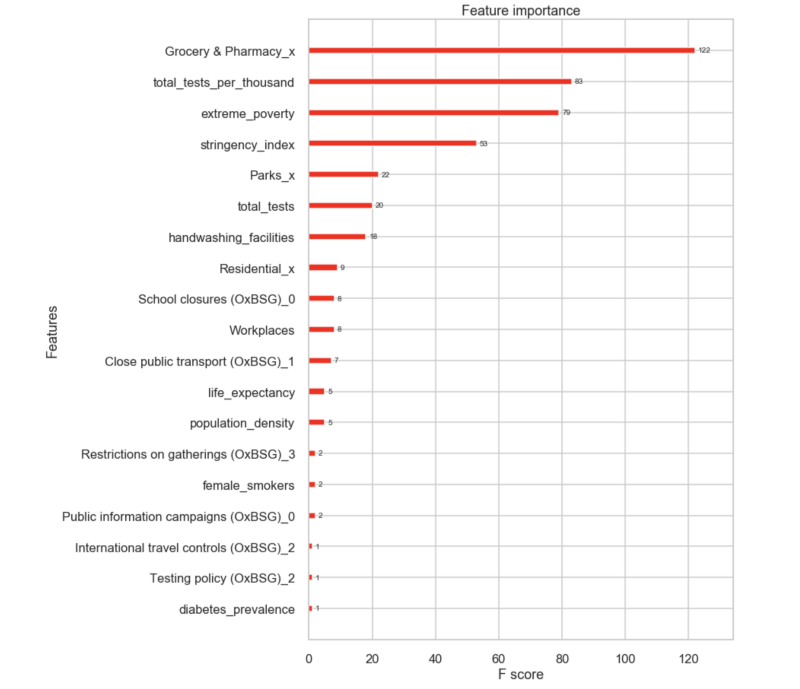
Many of the factors in the previous graph are present here as well since the number of deaths in a country is generally correlated with the number of cases. It is interesting to note that both the number of handwashing facilities and the change in movement to residential areas rank higher in the list of important factors in the number of deaths than in the previous list. Countries with more handwashing facilities are likely to have more widespread access to healthcare and better living conditions, which can reduce the number of deaths. The increase in movement to residential areas may contribute to an increase in deaths as the virus spreads through large gatherings in homes.
What factors have the greatest overall impact on the total number of recovered cases?
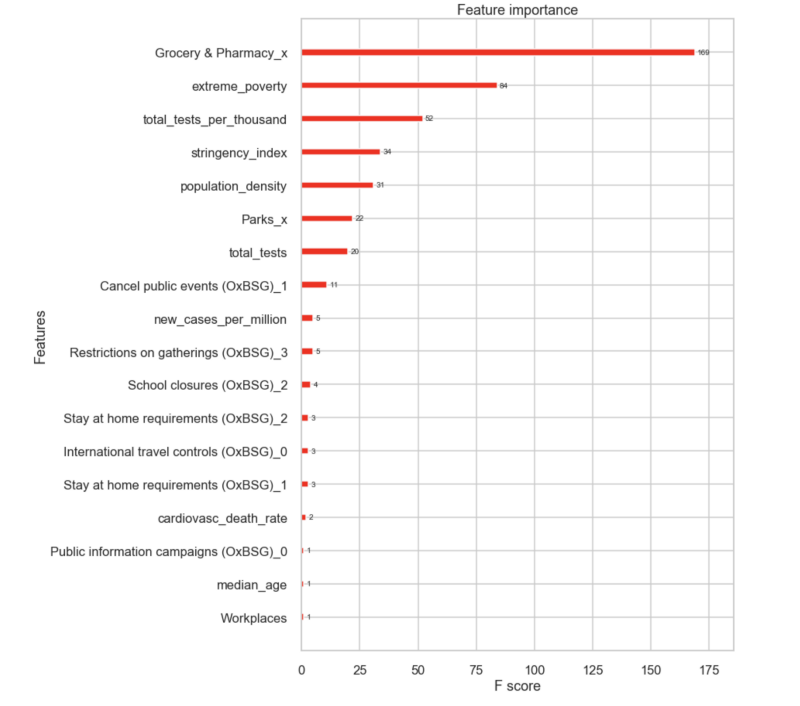
Many of the factors that appeared in the previous two graphs are present in this one as well. The cardiovascular death rate and median age are likely negatively correlated with the number of total recoveries. Countries with lower cardiovascular death rates and younger populations are likely to have more recoveries from COVID-19 cases.
COVID Forecasting Models
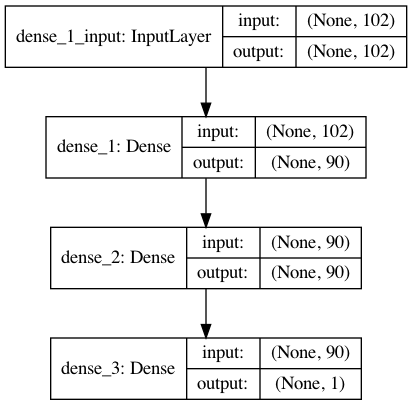
All of the models follow the same network architecture shown below. Each model is a deep neural network with two hidden layers containing 90 neurons each. These models are designed to predict the change in confirmed cases, deaths, and recoveries for each day.
Each model was trained on a training set of 35,780 samples and tested on a testing set of 7956 samples. For each model, the following performance metrics were computed with reference to the testing set:
- R² Coefficient
- Adjusted R² Coefficient
- Mean Absolute Error (MAE)
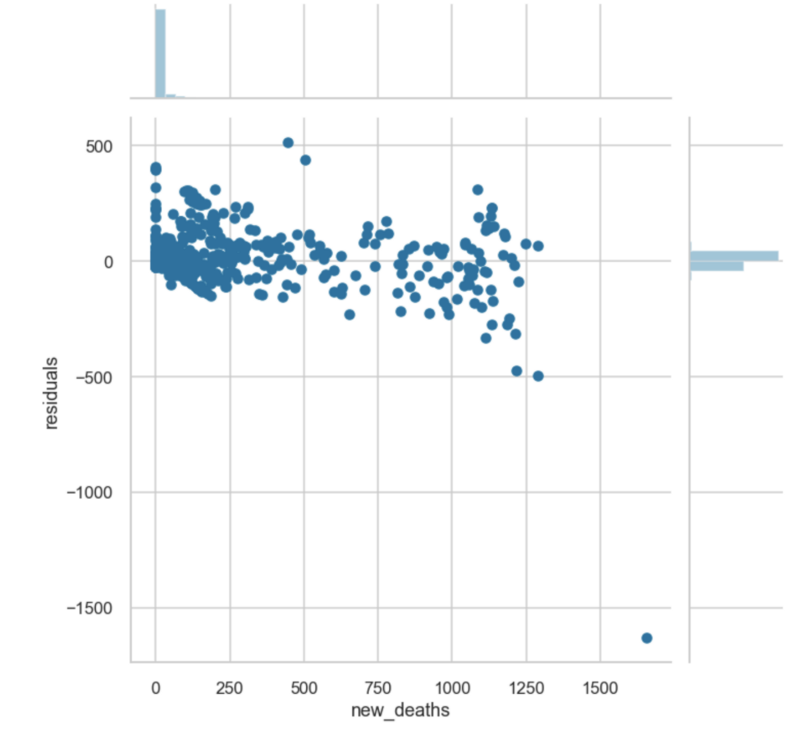
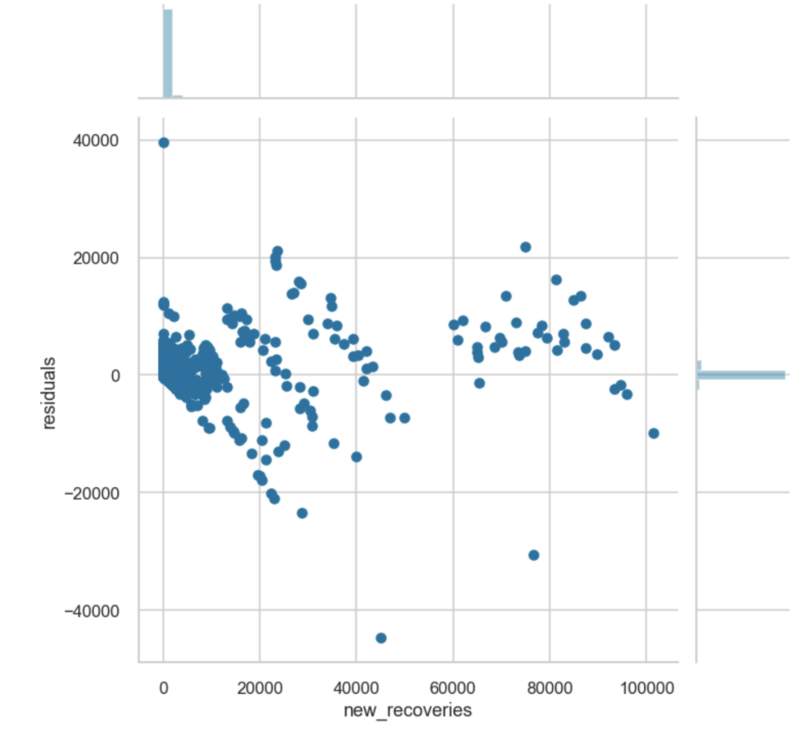
A residual plot was also constructed for each model to examine the distribution of prediction errors (residuals) on the testing data.
Cases Forecasting Model
Performance Metrics:
R² = 0.961
Adjusted R² = 0.96
MAE = 411.97
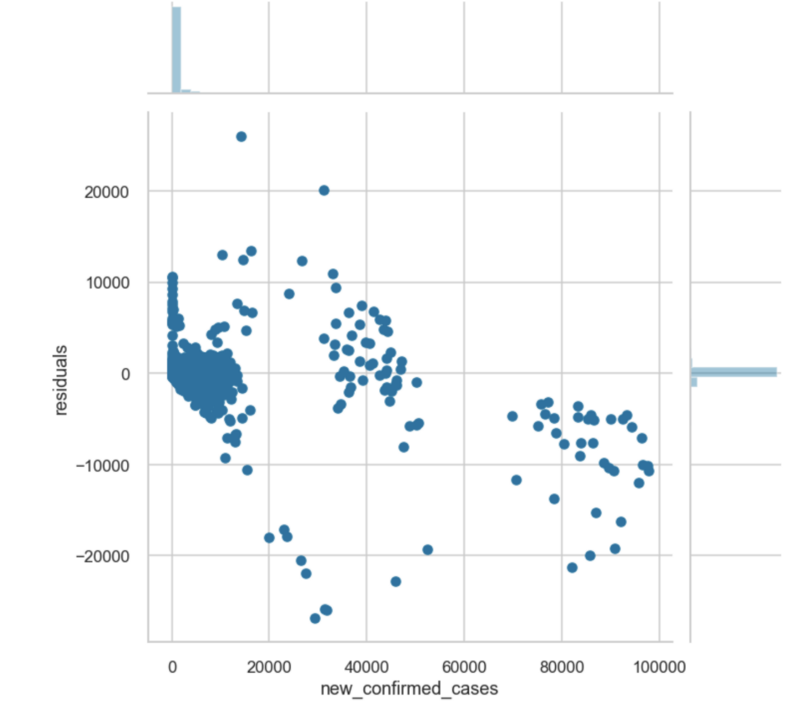
Deaths Forecasting Model
Performance Metrics:
R² = 0.91
Adjusted R² = 0.9
MAE = 11.15
Recovered Cases Forecasting Model
Performance Metrics:
R² = 0.93
Adjusted R² = 0.929
MAE = 513.26
Forecasts for the United States for the rest of 2020
Case 1: No Significant Changes in Mobility
These forecasts are based on the assumption that there are no changes in movement or in policies from now until the rest of 2020. Imagine taking a snapshot in time and assuming that the exact conditions in October do not change at all for the rest of the year. In this highly optimistic scenario, the deaths and confirmed cases still follow an approximately linear increase until the end of the year, with the number of confirmed cases nearing 12 million and the total number of deaths crossing 283,000.
Confirmed Cases
https://datapane.com/u/AmolMavuduru/reports/confirmed_cases_us_case1?version=7
Daily Cases
https://datapane.com/u/AmolMavuduru/reports/daily_cases_us_case1?version=5
Total Deaths
https://datapane.com/u/AmolMavuduru/reports/total_deaths_us_case1?version=5
Daily Deaths
https://datapane.com/u/AmolMavuduru/reports/daily_deaths_us_case1?version=5
Case 2: A 5 Percent Increase in Mobility Each Day
In this scenario, the amount of movement to public places such as parks, grocery stores, and workplaces increases by 5 percent each day. This scenario produces nearly 15 million confirmed cases and around 348,000 deaths and the growth in cases and deaths is exponential rather than linear in nature. This dramatic shift only highlights how important social distancing and mobility restrictions are when controlling the spread of the virus.
Confirmed Cases
https://datapane.com/u/AmolMavuduru/reports/confirmed_cases_us_case3?version=1
Daily Cases
https://datapane.com/u/AmolMavuduru/reports/daily_cases_us_case3?version=1
Total Deaths
https://datapane.com/u/AmolMavuduru/reports/deaths_us_case3?version=2
Daily Deaths
https://datapane.com/u/AmolMavuduru/reports/daily_deaths_us_case3?version=2
Forecasts for the World
The following visualizations present COVID-19 case forecasts for the entire world for both scenarios. Note that these forecasts were generated using data until October 16.
Case 1: No Significant Changes in Mobility
https://datapane.com/u/AmolMavuduru/reports/covid_predictions_case1?version=4
Case 2: A 5% Increase in Mobility Each Day
https://datapane.com/u/AmolMavuduru/reports/covid_predictions_case3?version=3
Model Limitations
While these models are capable of generating reasonable COVID-19 forecasts, they have several limitations when compared to more sophisticated models such as the influential IHME model and when evaluated in a general context.
National vs. State-Level Predictions
These models generate predictions at the national level, which are still useful but less detailed than the state-level predictions generated by the popular IHME model for the United States.
Considering Mask Mandates
While these models take into account restrictions related to social distancing and closures of schools, workplaces, and public venues, they do not take mask mandates into account. The IHME model has generated predictions for COVID-19 cases and deaths depending on the level of mask usage.
What Happens If There is a Vaccine?
These models were trained with the assumption that a vaccine will not become widely available during the forecast window. If a vaccine becomes widely available, several countries could see a decline in cases and deaths that the models would not be able to predict.
Conclusions
- Social distancing and mobility restrictions are extremely important when controlling the spread of the virus because increases in movement to public places can have an exponential impact on the number of infections and deaths.
- Policies such as school closures, international travel control, restrictions on gatherings, and stay-at-home requirements have a significant impact on the number of confirmed cases, deaths, and recoveries for a given country.
- The models created in this investigation predict between roughly 12 million and 15 million total confirmed cases and between roughly 283,000 and 348,000 total deaths in the United States by 2021 depending on mobility changes over the next few months. These predictions are similar to those generated by the IHME model.
As I mentioned earlier, the code for this article is available on GitHub, feel free to check it out.
Sources
- M. Roser, H. Ritchie, E. O. Ospina, and J. Hasell, Coronavirus Pandemic (COVID-19) (2020), OurWorldInData.org.
- E. Dong, H. Du, and L. Gardner, An interactive web-based dashboard to track COVID-19 in real-time (2020), Lancet Inf Dis. Github repository: https://github.com/CSSEGISandData/COVID-19
- IHME COVID-19 Forecasting Team, Modeling COVID-19 scenarios for the United States (2020), Nature Medicine.