An introduction to this modern gradient-boosting library

If you’ve worked as a data scientist, competed in Kaggle competitions, or even browsed data science articles on the internet, there’s a high chance that you’ve heard of XGBoost. Even today, it is often the go-to algorithm for many Kagglers and data scientists working on general machine learning tasks.
While XGBoost is popular for good reasons, it does have some limitations, which I mentioned in my article below.
https://towardsdatascience.com/why-xgboost-cant-solve-all-your-problems-b5003a62d12a
Odds are, you’ve probably heard of XGBoost, but have you ever heard of CatBoost? CatBoost is another open-source gradient boosting library that was created by researchers at Yandex. While it might be slower than XGBoost, it still has several interesting features and could be used as an alternative or included in an ensemble model with XGBoost. For some benchmark datasets, CatBoost has even outperformed XGBoost.
In this article, I will compare this framework to XGBoost and demonstrate how to train a CatBoost model on a simple dataset.
How is CatBoost Different from XGBoost?
Like XGBoost, CatBoost is also a gradient-boosting framework. However, CatBoost has several features, such as the ones listed below, that make it different from XGBoost:
- CatBoost is a different implementation of gradient boosting and makes use of a concept called ordered boosting, which is covered in depth in the CatBoost paper.
- Because CatBoost features a different implementation of gradient boosting, it has the potential to outperform other implementations on certain tasks.
- CatBoost features visualization widgets for cross-validation and grid search that can be viewed in Jupyter notebooks.
- The Pool module in CatBoost supports preprocessing for categorical and text features.
For a complete list of features, be sure to check out the CatBoost documentation page. While CatBoost does have additional features, the main drawback of this implementation is that it is generally slower than XGBoost. But if you are willing to sacrifice speed, this tradeoff may be justifiable in certain situations.
Installation
To install CatBoost with pip, simply run the command listed below.
pip install catboost
Alternatively, you can also install CatBoost with Conda using the following commands.
conda config --add channels conda-forge
conda install catboost
Classification with CatBoost
In this tutorial, I will demonstrate how to train a classification model with CatBoost using a simple dataset generated using Scikit-learn. You can find the full code for this tutorial on GitHub.
Import Libraries
In the code below, I imported basic libraries like Numpy and Pandas along with some modules from CatBoost.
import numpy as np
import pandas as pd
from catboost import CatBoostClassifier, Pool, cv
Creating the Dataset
In the code below, I created a dataset with the make_classification function from Scikit-learn.
from sklearn.datasets import make_classification
X, y = make_classification(n_samples=50000,
                           n_features=20,
                           n_informative=15,
                           n_redundant=5,
                           n_clusters_per_class=5,
                           class_sep=0.7,
                           flip_y=0.03,
                           n_classes=2)
Next, we can split the dataset into training and testing sets using the code below.
from sklearn.model_selection import train_test_split
X_train, X_test, y_train, y_test = train_test_split(X, y, test_size=0.33, random_state=42)
Training the Model
CatBoost has a very simple Scikit-learn style API for training models. We can instantiate a CatBoostClassifier object and train it on the training data as demonstrated in the code below. Note that the iterations argument corresponds to the number of boosting iterations (or the number of trees).
model = CatBoostClassifier(iterations=100,
                           depth=2,
                           learning_rate=1,
                           loss_function='Logloss',
                           verbose=True)
model.fit(X_train, y_train)
Training the model will write the training loss in each iteration to standard output when the verbose argument is set to True.
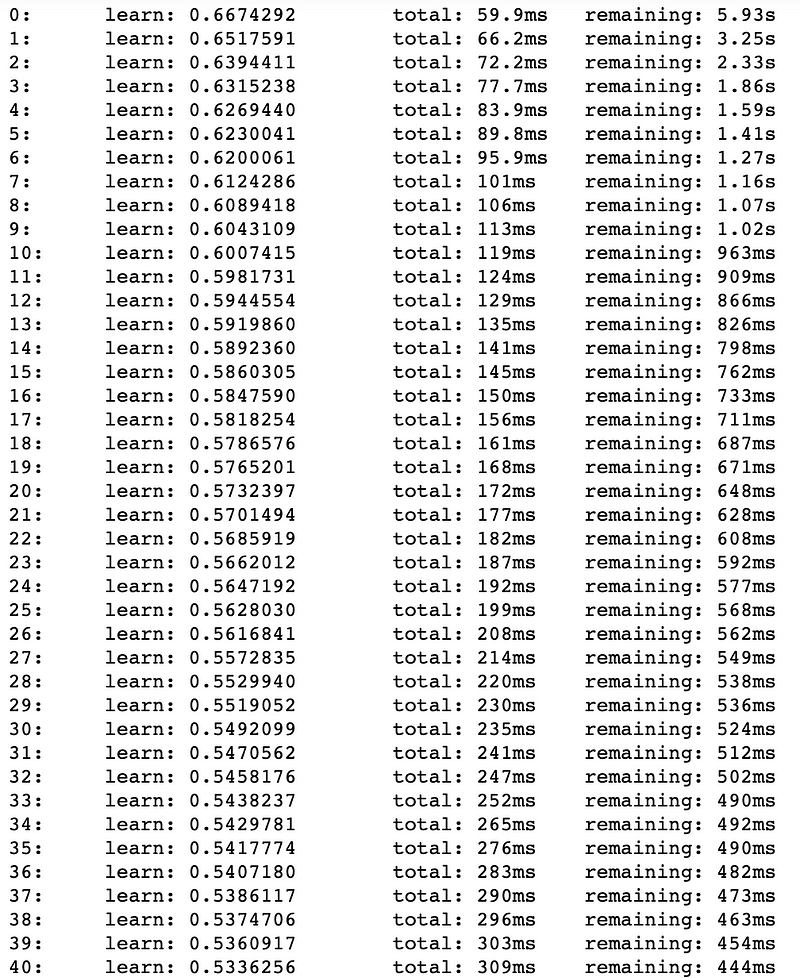
Note how the total time elapsed, as well as the time remaining is also written to the standard output.
Computing Feature Statistics
We can also compute detailed feature statistics from the training dataset using the calc_feature_statistics function as demonstrated below.
model.calc_feature_statistics(X_train, y_train, feature=1, plot=True)
Note that the feature argument indicates which feature to calculate statistics for. This argument can either be an integer for an index, a string to specify a feature name, or a list of strings or integers to specify multiple features.
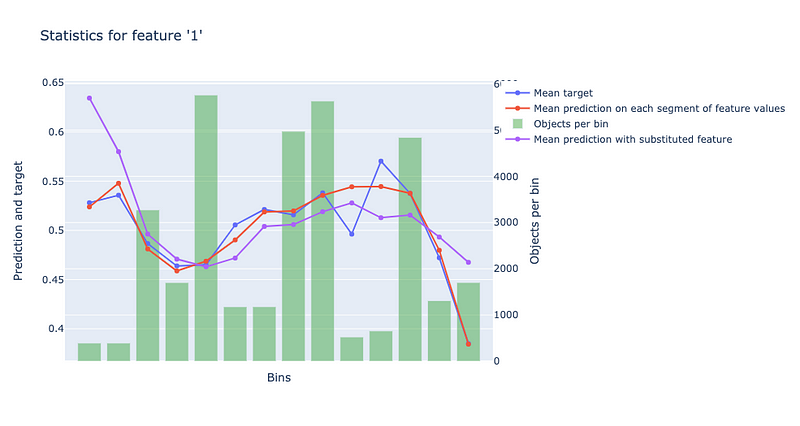
The graph above helps us understand the model’s behavior when it comes to predicting targets from feature values in different bins. These bins correspond to different value ranges for the specified feature and are used when creating the decision trees in the CatBoost model.
Getting Feature Importances
We can also compute feature importance with a trained CatBoost model. In order to do this, we first have to take the training data and transform it into a preprocessed CatBoost dataset using the Pool module. After that, we can simply use the get_feature_importance function as demonstrated below.
train_data = Pool(data=X_train, label=y_train)
model.get_feature_importance(train_data)
The function returns a Numpy array of feature importances as shown below.
array([3.01594829, 7.75329451, 5.20064972, 4.43992429, 4.30243392,
       8.32023227, 9.08359773, 2.73403973, 7.11605088, 2.31413571,
       7.76344028, 1.95471762, 6.66177812, 7.78073865, 1.63636954,
       4.66399329, 4.33191962, 1.836554  , 1.96756493, 7.12261691])
Cross-Validation
In order to perform cross-validation with CatBoost, we need to complete the following steps:
- Create a preprocessed dataset using the Pool module.
- Create a dictionary of parameters for the CatBoost model.
- Use the cv function to generate cross-validation scores for the model.
Note that the Pool module also includes optional arguments for preprocessing text and categorical features but since all of the features in our dataset are numerical, I didn’t have to use any of these arguments in this example.
cv_dataset = Pool(data=X_train,
                  label=y_train)
params = {"iterations": 100,
          "depth": 2,
          "loss_function": "Logloss",
          "verbose": False}
scores = cv(cv_dataset,
            params,
            fold_count=5,
            plot="True")
Running the code above with the plot argument set to True gives us a cool widget shown below in our Jupyter notebook.
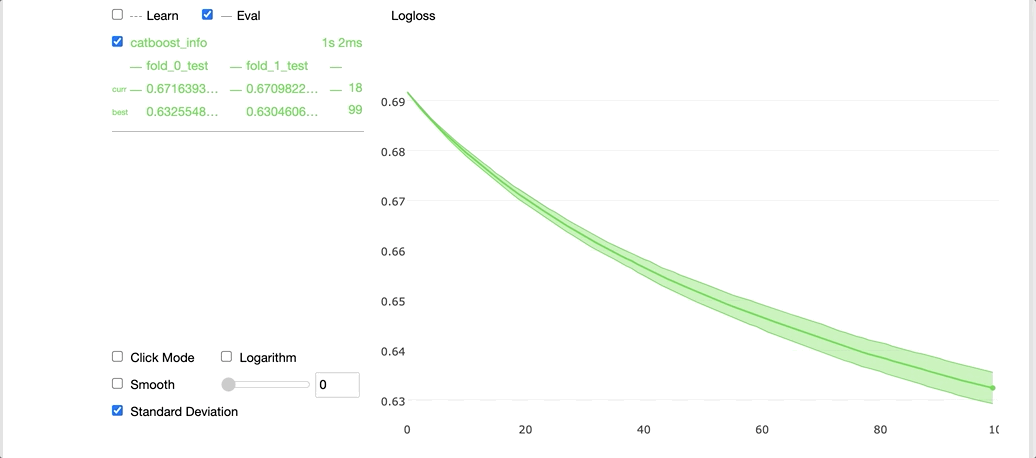
On the left-hand side, we can see the cross-validation results for each fold, and on the right-hand side, we can see a graph with the average learning curve for the model along with the standard deviations. The x-axis contains the number of iterations and the y-axis corresponds to the validation loss values.
Grid Search
We can also perform a grid search where the library compares the performance of different hyperparameter combinations to find the best model as demonstrated below.
model = CatBoostClassifier(loss_function='Logloss')
grid = {'learning_rate': [0.03, 0.1],
        'depth': [4, 6, 10]}
grid_search_result = model.grid_search(grid,
                                       X=X_train,
                                       y=y_train,
                                       cv=3,
                                       plot=True)
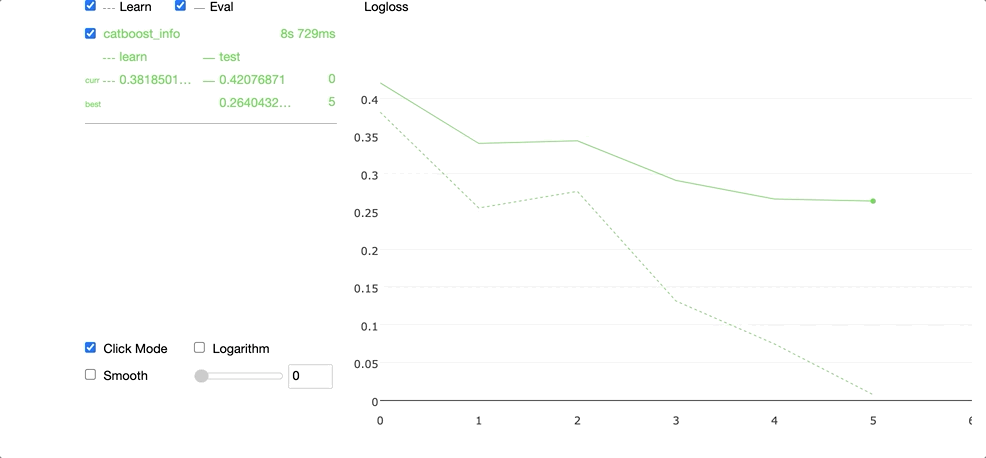
Running the code above produces the widget demonstrated in the GIF below.
We can access the best parameters in the grid search by selecting the params attribute.
print(grid_search_result['params'])
The print statement above gives us the best parameters in the grid search, listed below.
{'depth': 10, 'learning_rate': 0.1}
Testing the Model
We can generate predictions from a trained CatBoost model by running the predict function.
model.predict(X_test)
Running the predict function above produces a Numpy array of class labels as shown below.
array([0, 1, 0, ..., 0, 1, 1])
If we want to evaluate the model’s performance on the test data, we can use the score function as demonstrated below.
model.score(X_test, y_test)
Running the function above produced the following output.
0.906
Based on the result above, we can see that the model achieved a testing accuracy of 90.6 percent.
Saving the Model
You can also save a CatBoost in various formats, such as PMML as demonstrated in the code below.
model.save_model(
    "catboost.pmml",
    format="pmml",
    export_parameters={
        'pmml_copyright': 'my copyright (c)',
        'pmml_description': 'test model for BinaryClassification',
        'pmml_model_version': '1'
    }
)
Summary
CatBoost is an updated gradient-boosting framework with additional features that make it worth considering as a potential alternative to XGBoost. It may not be as fast, but it does have useful features and has the potential to outperform XGBoost on certain tasks because it is an improved implementation of gradient boosting.
As usual, you can find the code used in this article on GitHub.
Sources
- L. Prokhorenkova, G. Gusev, et. al, CatBoost: unbiased boosting with categorical features, (2019), arXiv.org.